This blog is a part of my journey “Embarking on the AWS Solution Architect Associate SAA-CO3 Certification Journey”
Table of Content
- Amazon CloudWatch
- Metrics
- CloudWatch Metric Streams
- CloudWatch Logs
- CloudWatch Logs Insights
- CloudWatch Logs – S3 Export
- CloudWatch Logs Subscriptions
- CloudWatch Logs for EC2
- CloudWatch Logs Agent & Unified Agent
- CloudWatch Alarms
- CloudWatch Alarms – Composite Alarms
- Insights
- CloudWatch Container Insights
- CloudWatch Lambda Insights
- CloudWatch Contributor Insights
- CloudWatch Application Insights
- Amazon Event Bridge
- Introduction
- Event Bridge Rules
- Amazon Event Bus
- Schema Registry
- Resource-based Policy
- AWS CloudTrail
- CloudTrail Events
- Management Events:
- Data Event
- CloudTrail Insights
- CloudTrail Events
- AWS Config
- Config Rules
- AWS Config Resource
- Config Rules – Remediations
- Config Rules – Notifications
- CloudWatch vs CloudTrail vs Config
Amazon CloudWatch
Metrics
- CloudWatch provides metrics for every services in AWS
- Metric is a variable to monitor (CPUUtilization, NetworkIn…)
- Metrics belong to namespaces
- Dimension is an attribute of a metric (instance id, environment, etc…).
- Up to 30 dimensions per metric
- Metrics have timestamps
- Can create CloudWatch dashboards of metrics
- Can create CloudWatch Custom Metrics (for the RAM for example)
CloudWatch Metric Streams
- Continually stream CloudWatch metrics to a destination of your choice, with near-real-time delivery and low latency.
- Amazon Kinesis Data Firehose (and then its destinations)
- 3rd party service provider: Datadog, Dynatrace, New Relic, Splunk, Sumo Logic.
- Option to filter metrics to only stream a subset of them
CloudWatch Logs
- Log groups: arbitrary name, usually representing an application
- Log stream: instances within application / log files / containers
- Can define log expiration policies (never expire, 1 day to 10 years…)
- CloudWatch Logs can send logs to:
- Amazon S3 (exports)
- Kinesis Data Streams
- Kinesis Data Firehose
- AWS Lambda
- OpenSearch
- Logs are encrypted by default
- Can setup KMS-based encryption with your own keys
- Log Sources
- SDK, CloudWatch Logs Agent, CloudWatch Unified Agent
- Elastic Beanstalk: collection of logs from application
- ECS: collection from containers
- AWS Lambda: collection from function logs
- VPC Flow Logs:VPC specific logs
- API Gateway
- CloudTrail based on filter
- Route53: Log DNS queries
CloudWatch Logs Insights
- Search and analyze log data stored in CloudWatch Logs
- Example: find a specific IP inside a log, count occurrences of “ERROR” in your logs
- Provides a purpose-built query language
- Automatically discovers fields from AWS services and JSON log events
- Fetch desired event fields, filter based on conditions, calculate aggregate statistics, sort events, limit number of events
- Can save queries and add them to CloudWatch Dashboards
- Can query multiple Log Groups in different AWS accounts
- It’s a query engine, not a real-time engine
CloudWatch Logs – S3 Export
- Log data can take up to 12 hours to become available for export
- The API call is CreateExport Task
- Not near-real time or real-time… use Logs Subscriptions instead.
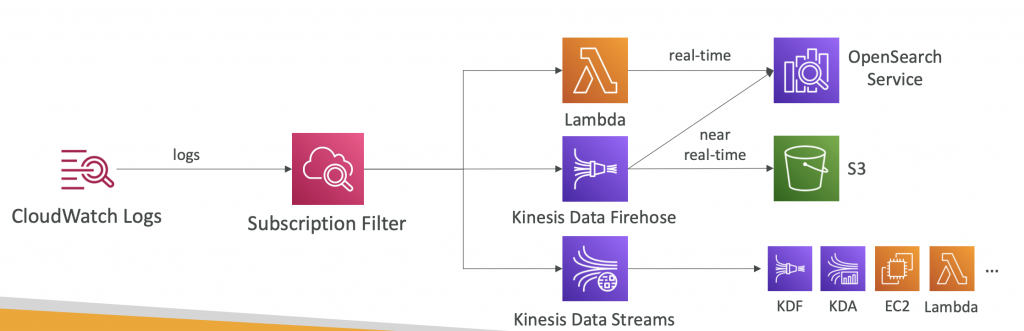
CloudWatch Logs Subscriptions
- Get a real-time log events from CloudWatch Logs for processing and analysis
- Send to Kinesis Data Streams, Kinesis Data Firehose, or Lambda
- Subscription Filter – filter which logs are events delivered to your destination
- Cross-Account Subscription – send log events to resources in a different AWS account
CloudWatch Logs for EC2
- By default, no logs from your EC2 machine will go to CloudWatch
- You need to run a CloudWatch agent on EC2 to push the log files you want
- Make sure IAM permissions are correct
- The CloudWatch log agent can be setup on-premises too
CloudWatch Logs Agent & Unified Agent
- For virtual servers (EC2 instances, on-premises servers…)
- CloudWatch Logs Agent
- Old version of the agent
- Can only send to CloudWatch Logs
- CloudWatch Unified Agent
- Collect additional system-level metrics such as RAM, processes, etc
- Collect logs to send to CloudWatch Logs
- Centralized configuration using SSM Parameter Store
- CloudWatch Unified Agent – Metrics
- Collected directly on your Linux server / EC2 instance
- CPU (active, guest, idle, system, user, steal)
- Disk metrics (free, used, total), Disk IO (writes, reads, bytes, iops)
- RAM (free, inactive, used, total, cached)
- Netstat (number of TCP and UDP connections, net packets, bytes)
- Processes (total, dead, bloqued, idle, running, sleep)
- Swap Space (free, used, used %)
- Reminder: out-of-the box metrics for EC2 – disk, CPU, network (high level)
CloudWatch Alarms
- Alarms are used to trigger notifications for any metriC
- Various options (sampling, %, max, min, etc…)
- Alarm States:
- OK
- INSUFFICIENT_DATA
- ALARM
- Period
- Length of time in seconds to evaluate the metric
- High resolution custom metrics: 10 sec, 30 sec or multiples of 60 sec
- CloudWatch Alarm Targets
- Stop,Terminate, Reboot, or Recover an EC2 Instance
- Trigger Auto Scaling Action
- Send notification to SNS (from which you can do pretty much anything)
CloudWatch Alarms – Composite Alarms
- CloudWatch Alarms are on a single metric
- Composite Alarms are monitoring the states of multiple other alarms
- AND and OR conditions
- Helpful to reduce “alarm noise” by creating complex composite alarms
Insights
CloudWatch Container Insights
- Collect, aggregate, summarize metrics and logs from containers
- Available for containers on
- Amazon Elastic Container Service (Amazon ECS)
- Amazon Elastic Kubernetes Services (Amazon EKS)
- Kubernetes platforms on EC2
- Fargate (both for ECS and EKS)
- In Amazon EKS and Kubernetes, CloudWatch Insights is using a containerized version of the CloudWatch Agent to discover containers
CloudWatch Lambda Insights
- Monitoring and troubleshooting solution for serverless applications running on AWS Lambda
- Collects, aggregates, and summarizes system-level metrics including CPU time, memory, disk, and network
- Collects, aggregates, and summarizes diagnostic information such as cold starts and Lambda worker shutdowns
- Lambda Insights is provided as a Lambda Layer
CloudWatch Contributor Insights
- Analyze log data and create time series that display contributor data.
- See metrics about the top-N contributors
- The total number of unique contributors, and their usage.
- This helps you find top talkers and understand who or what is impacting system performance.
- Works for any AWS-generated logs (VPC, DNS, etc..)
- For example, you can find bad hosts, identify the heaviest network users, or find the URLs that generate the most errors.
- You can build your rules from scratch, or you can also use sample rules that AWS has created – leverages your CloudWatch Logs
- CloudWatch also provides built-in rules that you can use to analyze metrics from other AWS services.
CloudWatch Application Insights
- Provides automated dashboards that show potential problems with monitored applications, to help isolate ongoing issues
- Your applications run on Amazon EC2 Instances with select technologies only (Java, .NET, Microsoft IIS Web Server, databases…)
- And you can use other AWS resources such as Amazon EBS, RDS, ELB, ASG, Lambda, SQS, DynamoDB, S3 bucket, ECS, EKS, SNS, API Gateway
- Powered by SageMaker
- Enhanced visibility into your application health to reduce the time it will take you to troubleshoot and repair your applications
- Findings and alerts are sent to Amazon EventBridge and SSM OpsCenter
Amazon Event Bridge
Introduction
- Schedule: Cron jobs (scheduled scripts)
- Schedule Every hour trigger Lambda
- Event Pattern: Event rules to react to a service doing something
- IAM Root User Sign in Event -> SNS Notification
- Trigger Lambda functions, send SQS/SNS messages
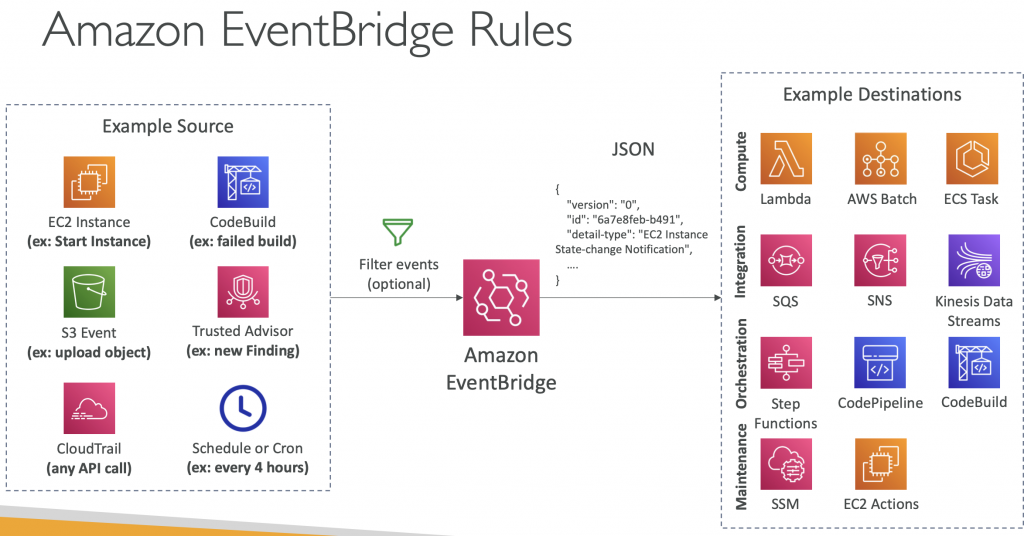
Event Bridge Rules
A rule matches incoming events and sends them to targets for processing. A single rule can send an event to multiple targets, which then run in parallel. Rules are based either on an event pattern or a schedule. An event pattern defines the event structure and the fields that a rule matches. Rules that are based on a schedule perform an action at regular intervals.
Amazon Event Bus
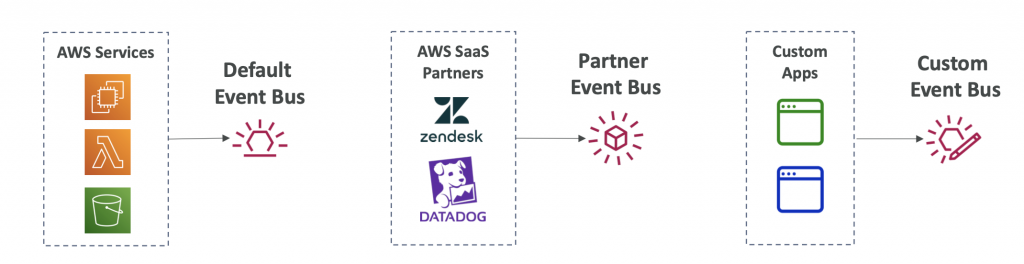
- Event buses receive events from a variety of sources and match them to rules in your account. Different types of event buses receive events from different sources, including AWS services in your account and other accounts, custom applications and services, and partner applications and services.
- Event buses can be accessed by other AWS accounts using Resource-based Policies
- You can archive events (all/filter) sent to an event bus (indefinitely or set period)
- Ability to replay archived events
Schema Registry
- EventBridge can analyze the events in your bus and infer the schema
- The Schema Registry allows you to generate code for your application, that will know in advance how data is structured in the event bus
- Schema can be versioned
Resource-based Policy
- Manage permissions for a specific Event Bus
- Example: allow/deny events from another AWS account or AWS region
- Use case: aggregate all events from your AWS Organization in a single AWS account or AWS region
AWS CloudTrail
- Provides governance, compliance and audit for your AWS Account
- CloudTrail is enabled by default
- Get an history of events / API calls made within your AWS Account by
- Console
- SDK
- CLI
- AWS Services
- Can put logs from CloudTrail into CloudWatch Logs or S3
- A trail can be applied to All Regions (default) or a single Region.
- If a resource is deleted in AWS, investigate CloudTrail first!
CloudTrail Events
Management Events:
- Operations that are performed on resources in your AWS account
- Examples
- Configuring security (IAM AttachRolePolicy)
- Configuring rules for routing data (Amazon EC2 CreateSubnet)
- Setting up logging (AWS CloudTrail CreateTrail)
- By default, trails are configured to log management events
- Can separate Read Events (that don’t modify resources) from Write Events (that may modify resources)
Data Event
- By default, data events are not logged (because high volume operations)
- Amazon S3 object-level activity (ex: GetObject, DeleteObject, PutObject): can separate Read and Write Events
- AWS Lambda function execution activity (the Invoke API)
Events are stored for 90 days in CloudTrail. To keep events beyond this period, log them to S3 and use Athena
CloudTrail Insights
- Enable CloudTrail Insights to detect unusual activity in your account:
- inaccurate resource provisioning
- hitting service limits
- Bursts of AWS IAM actions
- Gaps in periodic maintenance activity
- CloudTrail Insights analyzes normal management events to create a baseline
- And then continuously analyzes write events to detect unusual patterns
- Anomalies appear in the CloudTrail console
- Event is sent to Amazon S3
- An EventBridge event is generated (for automation needs)
AWS Config
- Helps with auditing and recording compliance of your AWS resources
- Helps record configurations and changes over time
- Questions that can be solved by AWS Config:
- Is there unrestricted SSH access to my security groups?
- Do my buckets have any public access?
- How has my ALB configuration changed over time?
- You can receive alerts (SNS notifications) for any changes
- AWS Config is a per-region service
- Can be aggregated across regions and accounts
- Possibility of storing the configuration data into S3 (analyzed by Athena)
Config Rules
- Can use AWS managed config rules (over 75)
- Can make custom config rules (must be defined in AWS Lambda)
- Ex: evaluate if each EBS disk is of type gp2
- Ex: evaluate if each EC2 instance is t2.micro
- Rules can be evaluated / triggered:
- For each config change
- And / or: at regular time intervals
- AWS Config Rules does not prevent actions from happening (no deny)
- Pricing: no free tier, $0.003 per configuration item recorded per region, $0.001 per config rule evaluation per region
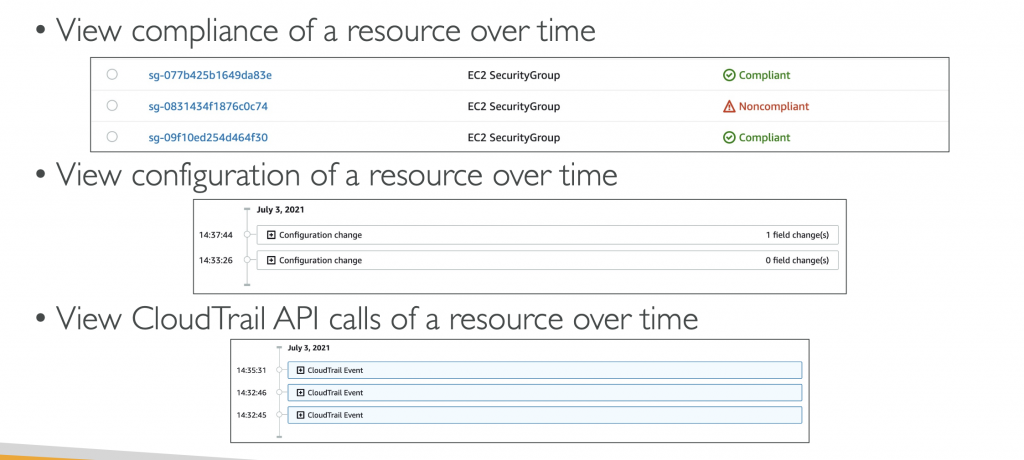
AWS Config Resource
Config Rules – Remediations
- Automate remediation of non-compliant resources using SSM Automation Documents
- Use AWS-Managed Automation Documents or create custom Automation Documents
- You can set Remediation Retries if the resource is still non-compliant after auto-
- remediation
Config Rules – Notifications
- Use EventBridge to trigger notifications when AWS resources are non- compliant
- Ability to send configuration changes and compliance state notifications to SNS (all events – use SNS Filtering or filter at client-side)
CloudWatch vs CloudTrail vs Config
- CloudWatch
- Performance monitoring (metrics, CPU, network, etc…) & dashboards
- Events & Alerting
- Log Aggregation & Analysis
- CloudTrail
- Record API calls made within your Account by everyone
- Can define trails for specific resources
- Global Service
- Config
- Record configuration changes
- Evaluate resources against compliance rules
- Get timeline of changes and compliance