Why Metrics Matter in Micronaut
Metrics play a crucial role in monitoring the health, performance, and resource utilization of microservices. In a Micronaut application, metrics provide valuable information such as:
- Resource Utilization: Understand how your application consumes resources like CPU, memory, and threads.
- HTTP Request Metrics: Monitor the incoming HTTP requests, response times, and error rates.
- Dependency Injection Metrics: Gain insights into the performance of Micronaut’s powerful dependency injection system.
- Cache and Database Metrics: Track the efficiency of caching and database operations.
- Custom Metrics: Define and measure application-specific metrics relevant to your use case.
Enabling Micronaut Metrics
Follow these steps to enable metrics in your Micronaut application:
Step 1: Add Dependencies
Add the necessary dependencies to your Micronaut project in build.gradle:
dependencies {
implementation "io.micronaut.micrometer:micronaut-micrometer-core"
implementation "io.micronaut:micronaut-management"
}
Step 2: Configure Metrics
Configure metrics in your application.yml or application.properties:
micronaut:
  metrics:
    enabled: true
Step 5: Run and Test
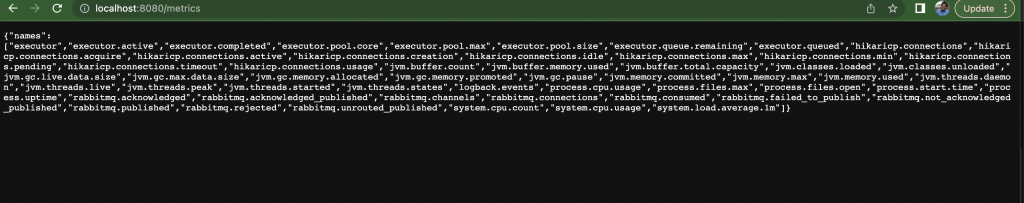
Run your Micronaut application, and access the metrics endpoint at http://localhost:8080/metrics. You should see a list of available metrics.
PR: https://github.com/cw-bhanunadar/Micronaut-playground/pull/18/files
Common Micronaut Metrics
HTTP Metrics
Micronaut provides HTTP-related metrics out of the box, such as:
http.server.requests: Tracks information about incoming HTTP requests.http.server.request.latency: Measures request processing time.
JVM Metrics
Monitor JVM-related metrics like memory usage, garbage collection, and thread counts:
jvm.memory.used: Tracks used memory.jvm.gc.pause: Measures garbage collection pause times.
Micronaut-Specific Metrics
Explore metrics related to Micronaut’s features:
micronaut.inject.beans: Dependency injection metrics.micronaut.cache: Cache-related metrics.
Visualizing Metrics
To visualize metrics effectively, consider integrating with monitoring tools like Prometheus and Grafana. This allows you to create interactive dashboards and set up alerting based on metric thresholds.
Conclusion
Enabling metrics in your Micronaut application provides real-time insights into its performance and behavior. Whether you’re tracking HTTP requests, JVM metrics, or custom application-specific metrics, Micronaut’s built-in support makes it easy to gather and analyze the data you need. Embrace the power of metrics for a proactive approach to monitoring and optimizing your microservices architecture.